Evaluating Models – Class 10 Artificial Intelligence NCERT Book Solutions

NCERT/CBSE Book Exercise Solutions
I. Multiple Choice Questions: Choose the most appropriate answer for each question.
- In a medical test for a rare disease, out of 1000 people tested, 50 actually have the disease while 950 do not. The test correctly identifies 40 out of the 50 people with the disease as positive, but it also wrongly identifies 30 of the healthy individuals as positive. What is the accuracy of the test?

A) 96%
B) 90%
C) 85%
D) 70%
Answer: A) 96%
Explanation:

- A student solved 90 out of 100 questions correctly in a multiple-choice exam. What is the error rate of the student’s answers?
A) 10%
B) 9%
C) 8%
D) 11%
Answer: A) 10 %
Explanation:
- Total questions = 100
- Correct answers = 90
- Incorrect answers (errors) = 100 − 90 = 10
Error rate is: 10%
- In a spam email detection system, out of 1000 emails received, 300 are spam. The system correctly identifies 240 spam emails as spam, but it also marks 60 legitimate emails as spam. What is the precision of the system?
A) 80%
B) 70%
C) 75%
D) 90%
Answer: A) 80 %
Explanation:
Precision = Correct Positive PredictionsTotal Positive Predictions = TP / (TP + FP) = 240 / (240 + 60 )
= 0.8 * 100% = 80%
- In a binary classification problem, a model predicts 50 instances as positive, out of which 70 are actually positive. What is the recall of the model?
A) 50%
B) 70%
C) 80%
D) 100%
Answer: B) 70 % (approx)
Explanation:
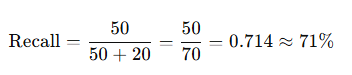
Recall = Correct Positive Predictions / Total Actual Positive Values
= TP / TP + FN
Actual positives = 70 , True Positive = 50, FN = 70 − 50 = 20.
- In a sentiment analysis task, a model correctly predicts 120 positive sentiments out of 200 positive instances. However, it also incorrectly predicts 40 negative sentiments as positive. What is the F1 score of the model?
A) 0.8
B) 0.75
C) 0.72
D) 0.82
Answer: None of these. (0.67)
Explanation:
F1 Score = (2 x Precision x Recall) / (Precision + Recall)
Precision = Correct Positive Predictions / Total Positive Predictions
= TP / (TP + FP) = 120/ (120 + 40) = 0.75
Recall = Correct Positive Predictions / Total Actual Positive Values
= TP/ (TP + FN = 120/ (120 + 80) = 0.6
F1 Score = (2 x Precision x Recall) / (Precision + Recall)
= (2 x 0.75 x 0.60) / (0.75 + 0.60) = 0.66667 = 0.67
- A medical diagnostic test is designed to detect a certain disease. Out of 1000 people tested, 100 have the disease, and the test identifies 90 of them correctly. However, it also wrongly identifies 50 healthy people as having the disease. What is the precision of the test?
A) 90%
B) 80%
C) 70%
D) 60%
Answer: D) 60% (approx)
Precision = Correct Positive Predictions / Total Positive Predictions
= TP / (TP + FP )= 90 / (90 + 50 )
= 90 / 140
= 0.64 = 60%
- A teacher’s marks prediction system predicts the marks of a student as 75, but the actual marks obtained by the student are 80. What is the absolute error in the prediction?
A) 5
B) 10
C) 15
D) 20
Answer: A) 5
Absolute Error = |Predicted Value−Actual Value| = [ 75 – 80 | = | -5 | = 5
- The goal when evaluating an AI model is to:
A) Maximize error and minimize accuracy
B) Minimize error and maximize accuracy
C) Focus solely on the number of data points used
D) Prioritize the complexity of the model
Answer: B) Minimize error and maximize accuracy
- A high F1 score generally suggests:
A) A significant imbalance between precision and recall
B) A good balance between precision and recall
C) A model that only performs well on specific data points
D) The need for more training data
Answer: B) A good balance between precision and recall
- How is the relationship between model performance and accuracy described?
A) Inversely proportional B) Not related
C) Directly proportional D) Randomly fluctuating
Answer: C) Directly proportional
Assertion and reasoning-based questions:
Options:
(a) Both A and R are true and R is the correct explanation for A
(b) Both A and R are true and R is not the correct explanation for A
(c) A is True but R is False
(d) A is false but R is True
Que 1. Assertion: Accuracy is an evaluation metric that allows you to measure the total number of predictions a model gets right.
Reasoning: The accuracy of the model and performance of the model is directly proportional, and hence better the performance of the model, the more accurate are the predictions.
Answer: (c) A is True but R is False (Note: R is partially correct, not a correct explanation of A)
Que 2. Assertion (A): The sum of the values in a confusion matrix’s row represents the total number of instances for a given actual class.
Reasoning (R): This enables the calculation of class-specific metrics such as precision and recall, which are essential for evaluating a model’s performance across different classes.
Answer: (b) Both A and R are true and R is not the correct explanation for A.
Answer the following questions:
Que 1. What will happen if you deploy an AI model without evaluating it with known test set data?
Answer: Skipping evaluation means deploying a “blind” model — you don’t know if it works, and it could fail badly in the real world.
If you deploy an AI model without evaluating it with known test set data, here’s what happens:
- No idea of accuracy/performance
- Risk of overfitting. Overfitting means, giving the correct output on training data only. The model may have simply memorized the training data.
- Unreliable decisions
- Bias and unfairness
- Loss of trust
Que 2. Do you think evaluating an AI model is that essential in an AI project cycle?
Answer: Yes. Evaluation of an AI model is the essential part of an AI project cycle. Why –
- Checking performance of model.
- Prevents overfitting/underfitting.
- Ensures reliability
- Compares models
- Validates fairness & bias
Que 3. Explain train-test split with an example.
Answer: What is Train-Test Split?
Train-test split is a model validation procedure that allows you to simulate how a model would perform on new/unseen data.
The train-test split is a technique for evaluating the performance of a machine learning algorithm. It can be used for any supervised learning algorithm.
- The procedure involves taking a dataset and dividing it into two subsets:
- The training dataset : The training set is data used to train the model.
- The testing dataset: The testing set data (which is new to the model) is used to test the model’s performance and accuracy.

- The train-test procedure is appropriate when there is a sufficiently large dataset available.
Que 4. “Understanding both error and accuracy is crucial for effectively evaluating and improving AI models.” Justify this statement.
Answer: Accuracy is an evaluation metric that allows you to measure the total number of predictions a model gets right.
The accuracy of the model and performance of the model is directly proportional, and hence better the performance of the model, the more accurate are the predictions.
Error measures how often or how much the model is wrong. It helps identify the weaknesses and areas where the model needs improvement.
By analyzing both, data scientists can:
- Detect bias or imbalanced data.
- Improve algorithms and parameters.
- Enhance generalization to unseen data
Understanding both accuracy (how right the model is) and error (how wrong it is) provides a complete picture of model performance.
Together, they help in evaluating, diagnosing, and improving AI models effectively — ensuring the model is not only accurate but also reliable and robust.
Que 5. What is classification accuracy? Can it be used all times for evaluating AI models?
Answer: Classification accuracy is the number of correct predictions made as a ratio of all predictions made.
Classification Accuracy = Correct PredictionsTotal Predictions x 100
Classification accuracy is not always a reliable metric — especially when the dataset is imbalanced.
When accuracy can be misleading
Suppose you have:
- 95 positive cases
- 5 negative cases
If your model predicts everything as positive, it will still have 95% accuracy, but it completely fails to detect negative cases.
In such cases, accuracy looks high, but the model is poor in real performance.
Case study-based questions:
Que 1. Identify which metric (Precision or Recall) is to be used in the following cases and why?
a) Email Spam Detection
b) Cancer Diagnosis
c) Legal Cases (Innocent until proven guilty)
d) Fraud Detection
e) Safe Content Filtering (like Kids YouTube)
Answer: When we have to use precision and recall:
- Using precision when being correct about positives is more important (avoiding false alarms).
- Use Recall when catching all positives is more important (not missing any).
(a) Spam Detection → Precision
Reason: If we wrongly mark an important email as spam (false positive), the user may miss it. So we want to be very sure before calling something spam.
(b) Cancer Diagnosis → Recall
Reason: Missing a real cancer case (false negative) is very dangerous. It’s better to detect all possible cases, even if a few healthy people are wrongly flagged.
(c) Legal Cases → Precision
Reason: It’s worse to punish an innocent person (false positive) than to miss some guilty ones. So we need high precision before declaring someone guilty.
(d) Fraud Detection → Recall
Reason: We don’t want to miss real fraud cases (false negatives) because they can cause big financial loss. A few extra checks on genuine users (false positives) are acceptable.
(e) Safe Content Filtering → Recall
Reason: It’s very important to catch all harmful content. Missing one inappropriate video (false negative) is dangerous. A few safe videos wrongly blocked are less harmful.
Que 2. Examine the following case studies. Draw the confusion matrix and calculate metrics such as accuracy, precision, recall, and F1-score for each one of them.
a. Case Study 1:
A spam email detection system is used to classify emails as either spam (1) or not spam (0). Out of 1000 emails:
- True Positives (TP): 150 emails were correctly classified as spam.
- False Positives (FP): 50 emails were incorrectly classified as spam.
- True Negatives (TN): 750 emails were correctly classified as not spam.

- False Negatives (FN): 50 emails were incorrectly classified as not spam. –
Answer:
Accuracy:
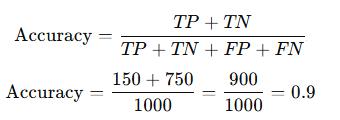
Accuracy = 0.9 (or 90%)
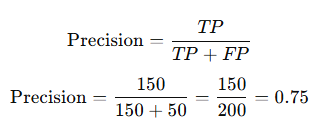
Precision = 0.75 (or 75%)
Recall = 0.75 (or 75%)
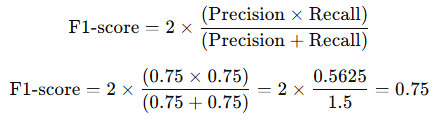
F1-Score = 0.75 (or 75%)
b. Case Study 2:
A credit scoring model is used to predict whether an applicant is likely to default on a loan (1) or not (0). Out of 1000 loan applicants:
- True Positives (TP): 90 applicants were correctly predicted to default on the loan.
- False Positives (FP): 40 applicants were incorrectly predicted to default on the loan.
- True Negatives (TN): 820 applicants were correctly predicted not to default on the loan.
- False Negatives (FN): 50 applicants were incorrectly predicted not to default on the loan.

Calculate metrics such as accuracy, precision, recall, and F1-score.
Answer:
1. Accuracy
Accuracy = (TP + TN) / (TP + TN + FP + FN)
= (90 + 820) / 1000 = 910 / 1000
= 0.91 or 91%
2. Precision
Precision = TP / (TP + FP)
= 90 / (90 + 40) = 90 / 130
= 0.69 or 69.23%
3. Recall (Sensitivity)
Recall = TP / (TP + FN)
= 90 / (90 + 50)
= 90 / 140
= 0.64 or 64.29%
4. F1-Score
F1-Score = 2 × (Precision × Recall) / (Precision + Recall)
= 2 × (0.69 × 0.64) / (0.69 + 0.64)
= 2 × 0.4416 / 1.33
= 0.67 or 66.73%
Final Metrics Summary
Accuracy = 91%
Precision = 69.23%
Recall = 64.29%
F1-Score = 66.73%
c. Case Study 3:
A fraud detection system is used to identify fraudulent transactions (1) from legitimate ones (0). Out of 1000 transactions:
- True Positives (TP): 80 transactions were correctly identified as fraudulent.
- False Positives (FP): 30 transactions were incorrectly identified as fraudulent.
- True Negatives (TN): 850 transactions were correctly identified as legitimate.
- False Negatives (FN): 40 transactions were incorrectly identified as legitimate.
Ans: 
1. Accuracy
Accuracy = (TP + TN) / (TP + TN + FP + FN)
= (80 + 850) / 1000
= 930 / 1000
= 0.93 or 93%
2. Precision
Precision = TP / (TP + FP)
= 80 / (80 + 30)
= 80 / 110
= 0.73 or 72.73%
3. Recall (Sensitivity)
Recall = TP / (TP + FN)
= 80 / (80 + 40)
= 80 / 120
= 0.67 or 66.67%
4. F1-Score
F1-Score = 2 × (Precision × Recall) / (Precision + Recall)
= 2 × (0.73 × 0.67) / (0.73 + 0.67)
= 2 × 0.4891 / 1.40
= 0.70 or 69.86%
Final Metrics Summary
Accuracy = 93%
Precision = 72.73%
Recall = 66.67%
F1-Score = 69.86%
d. Case Study 4:
A medical diagnosis system is used to classify patients as having a certain disease (1) or not having it (0). Out of 1000 patients:
- True Positives (TP): 120 patients were correctly diagnosed with the disease.
- False Positives (FP): 20 patients were incorrectly diagnosed with the disease.
- True Negatives (TN): 800 patients were correctly diagnosed as not having the disease.

- False Negatives (FN): 60 patients were incorrectly diagnosed as not having the disease.
Answer:
1. Accuracy
Accuracy = (TP + TN) / (TP + TN + FP + FN)
= (120 + 800) / 1000
= 920 / 1000
= 0.92 or 92%
2. Precision
Precision = TP / (TP + FP)
= 120 / (120 + 20)
= 120 / 140
= 0.86 or 85.71%
3. Recall (Sensitivity)
Recall = TP / (TP + FN)
= 120 / (120 + 60)
= 120 / 180
= 0.67 or 66.67%
4. F1-Score
F1-Score = 2 × (Precision × Recall) / (Precision + Recall)
= 2 × (0.86 × 0.67) / (0.86 + 0.67)
= 2 × 0.5762 / 1.53
= 0.75 or 75.29%
Final Metrics Summary
Accuracy = 92%
Precision = 85.71%
Recall = 66.67%
F1-Score = 75.29%
e. Case Study 5:
An inventory management system is used to predict whether a product will be out of stock (1) or not (0) in the next month. Out of 1000 products:
- True Positives (TP): 100 products were correctly predicted to be out of stock.
- False Positives (FP): 50 products were incorrectly predicted to be out of stock.
- True Negatives (TN): 800 products were correctly predicted not to be out of stock.
- False Negatives (FN): 50 products were incorrectly predicted not to be out of stock.
Answer:
1. Accuracy
Accuracy = (TP + TN) / (TP + TN + FP + FN)
= (100 + 800) / 1000
= 900 / 1000
= 0.90 or 90%
2. Precision
Precision = TP / (TP + FP)
= 100 / (100 + 50)
= 100 / 150
= 0.67 or 66.67%
3. Recall (Sensitivity)
Recall = TP / (TP + FN)
= 100 / (100 + 50)
= 100 / 150
= 0.67 or 66.67%
4. F1-Score
F1-Score = 2 × (Precision × Recall) / (Precision + Recall)
= 2 × (0.67 × 0.67) / (0.67 + 0.67)
= 2 × 0.4489 / 1.34
= 0.67 or 66.67%
Final Metrics Summary
Accuracy = 90%
Precision = 66.67%
Recall = 66.67%
F1-Score = 66.67%
By Anjeev Kr Singh – Computer Science Educator
Published on : January 6, 2026 | Updated on : January 6, 2026
About the Author