Class 10 AI Unit 3 Evaluating Models – Evaluation metrics for Classification and Ethical Concerns Notes with worksheet
Evaluation Metrics for Classification
What is Classification?
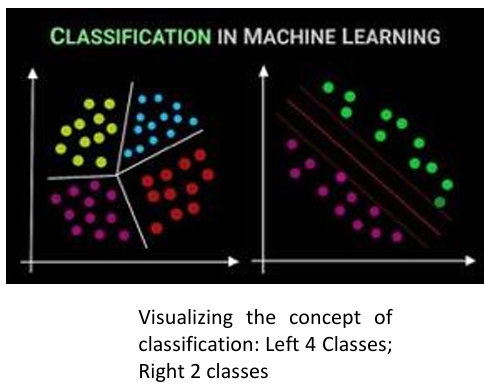
Classification usually refers to a problem where a specific type of class label is the result to be predicted from the given input field of data.
For example, here we are working on a vegetable- grocery-classifier model that predicts whether the item in the supermarket is a vegetable or a grocery item.
Que: Which of this is a classification use case example?
- House price prediction
- Credit card fraud detection
- Salary prediction
Ans: b) Credit card fraud detection
Explanation:
- House price prediction → Regression (predicting continuous values)
- Salary prediction → Regression (predicting continuous values)
- Credit card fraud detection → Classification (fraud / not fraud = categorical labels)
Classification metrics
Classification Metrics are the measures used to evaluate how well a classification model performs in predicting categorical outcomes (e.g., spam vs not spam, fraud vs not fraud).
Popular Classification metrics used for classification model are
- Confusion matrix
- Classification accuracy
- Precision
- Recall
- F1-Score
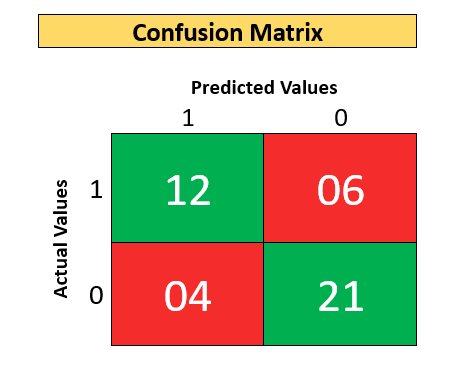
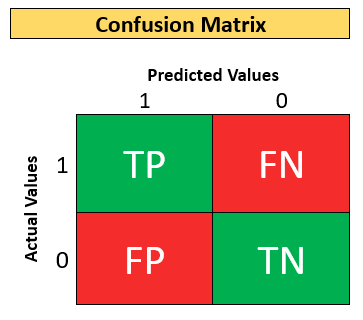
Confusion matrix
The confusion matrix is a handy presentation of the accuracy of a model with two or more classes.
- The table presents the actual values on the y-axis and predicted values on the x-axis.
- The numbers in each cell represent the number of predictions made by a machine learning algorithm that falls into that particular category.
For example:
Based on some clinical parameters, you have designed a classifier that predicts whether a person is infected with a certain disease or not.
- The output is 1 if the person is infected or 0 if the person is not infected. That is, 1 and 0 signify whether a person is infected or not.
Confusion Matrix of a total 43 patients.
1 – Means Infected with disease 0 – Means not infected with disease.
| Actual Value | Predicted Value | Meaning/Description |
| 1 | 1 | Actual is 1 and Prediction is 1. It means the person infected with the disease is also predicted as being infected. |
| 1 | 0 | Actual is 1 and Prediction is 0. It means the person infected with the disease is predicted as not being infected. |
| 0 | 1 | Actual is 0 and Prediction is 1. It means the person not infected with the disease is predicted as being infected. |
| 0 | 0 | Actual is 0 and Prediction is 0. It means the person not infected with the disease is also predicted as being not infected. |
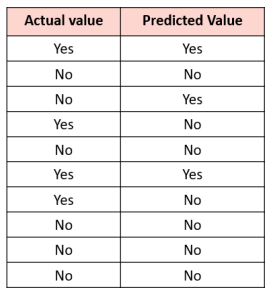
Activity 2: Build the confusion matrix from scratch
Instructions:
- Let’s assume we were predicting the presence of a disease; for example, “yes” would mean they have the disease, and “no” would mean they don’t have the disease
- So, the AI model will have output is Yes or No
- The following chart shows the actual values and the predicted values
- Construct a confusion matrix.
- Can you tell how many are correct predictions among all predictions?
Solution:
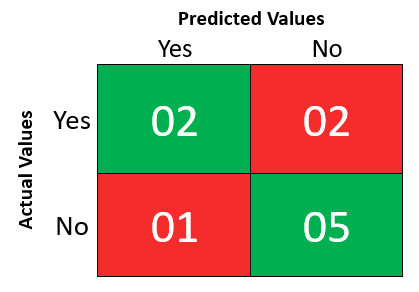
- Count the number of rows having YES in both columns of the table and put the count in the first cell.
- Count the number of rows having YES in the first column and NO in the second column will be shown in the top right cell of the confusion matrix.
- The number of rows having NO in the first column and YES in the second column will be shown in the down left cell of the confusion matrix.
- Lastly, the number of rows having NO in the first column and NO in the second column will be shown in the downright cell of the confusion matrix.
Activity Reflection
- So, there are 07 correct predictions out of 10 predictions.
- What do you think? How good is your model?
Let’s Understand the Confusion Matrix:
- Now that you know how to construct a Confusion matrix, let’s understand each cell of the matrix in detail.
True Positive:
- True Positive (TP) is the outcome of the model correctly predicting the positive class.
- Here, when class 1 is predicted as class 1, it falls into the TP cell.
True Negative:
- True Negative (TN) is the outcome of the model correctly predicting the negative class.
- Here, when class 0 is predicted as class 0, it falls into the TN cell.
False Positive:
- False Positive (FP) is the outcome of the model wrongly predicting the negative class as the positive class.
- Here, when a class 0 is predicted as class 1, it falls into the FP cell.
False Negative:
- False Negative (FN) is the outcome of the model wrongly predicting the positive class as the negative class.
- Here, when class 1 is predicted as class 0, it falls into the FN cell.
Accuracy from the Confusion matrix
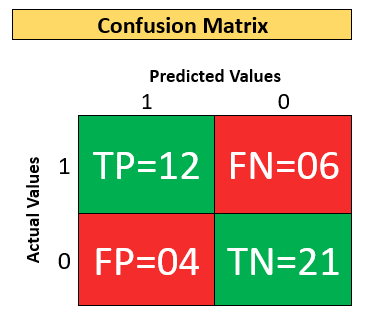
Classification accuracy is the number of correct predictions made as a ratio of all predictions made.
Que. Calculate the Classification accuracy from this confusion matrix.
Sol:
Correct Predictions = TP + TN
Total Predictions = TP + TN + FP + FN
Classification Accuracy = Correct Predictions / Total Predictions
= (TP + TN) / (TP + TN + FP + FN) = (12 +21) / (12 + 21 + 4 + 6 )
= 33/43 = 0.767
When Accuracy is Suitable?
It is only suitable when there are an equal number of observations in each class, i.e., a balanced dataset (which is rarely the case), and when all predictions and prediction errors are equally important, which is often not the case.
Activity 3: Calculate the accuracy of the classifier model
- Purpose: To design an AI model that predicts whether a student will pass a test (Yes) or not pass a test (No).
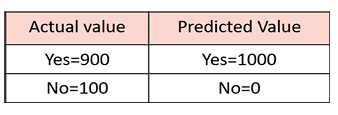
- Let’s assume you are testing your model on 1000 total test data.
- Out of which the actual values are 900 Yes and only 100 No (Unbalanced dataset).
- Let’s assume that you have built a faulty model which, irrespective of any input, will give a prediction as Yes. So, the faulty model will predict all the 1000 input data as Yes.
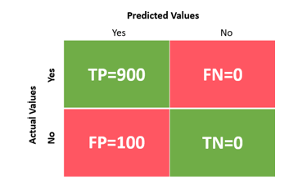
Solution: Accuracy from Confusion Matrix
Classification Accuracy = Correct Predictions / Total Predictions
= (TP + TN) / (TP + TN + FP + FN) = 900 + 0900 + 0 + 100 + 0
= 900/1000 = 0.9
Accuracy % = 0.9 x 100% = 90%
Note: So, the faulty model you made is showing an accuracy of 90%. Does this make sense?
So, in cases of unbalanced data, we should use other metrics such as Precision, Recall or F1 score.
Precision from the confusion matrix
Precision is the ratio of the total number of correctly classified positive examples and the total number of predicted positive examples.
Precision = Correct Positive PredictionsTotal Positive Predictions = TPTP + FP
Where should we use Precision?
The metrics precision is generally used for unbalanced datasets when dealing with the False Positives becomes important, and the model needs to reduce the FPs as much as possible.
Precision use case example
- For example, take the case of predicting a good day based on weather conditions to launch a satellite.
- Let’s assume a day with favorable weather condition is considered Positive class and a day with non-favorable weather condition is considered as Negative class.
- Missing out on predicting a good weather day is okay (low recall) but predicting the bad weather day (Negative class) as a good weather day (Positive class) to launch the satellite can be disastrous.
- So, in this case, the FPs need to be reduced as much as possible.
Recall from the confusion matrix
The recall is the measure of our model correctly identifying True Positives . Recall is also called as Sensitivity or True Positive Rate.
- Thus, for all the patients who actually have heart disease, recall tells us how many we correctly identified as having a heart disease.
- Recall = 0.86 tells us that out of the total patients who have heart disease 86% have been correctly identified.
Recall = Correct Positive PredictionsTotal Actual Positive Values = TPTP + FN
Where should we use Recall?
The metrics Recall is generally used for unbalanced dataset when dealing with the False Negatives becomes important and the model needs to reduce the FNs as much as possible.
Recall use case example
- For example, for a covid-19 prediction classifier, let’s consider detection of a covid-19 affected case as positive class and detection of covid-19 non-affected case as negative class.
- Imagine if a covid-19 affected person (Positive) is falsely predicted as non-affected of Covid-19 (Negative), the person if rely solely on the AI would not get any treatment and also may end up infecting many other persons.
- So, in this case, the FNs needs to be reduced as much as possible. .
F1 Score
F1-Score provides a way to combine both precisions and recall into a single measure that captures both properties
- In those use cases, where the dataset is unbalanced, and we are unable to decide whether FP is more important or FN, we should use the F1 score as the suitable metric.
F1 Score = 2 x Precision x RecallPrecision + Recall
Activity 4: Decide the appropriate metric to evaluate the AI model
Note: Different evaluation metrics are used for evaluation in different scenarios and it is important that we realize how to choose the correct one.
Purpose: To work with the given scenario and choose the most appropriate evaluation metric to evaluate their model.
Scenario: Flagging fraudulent transactions
- You have designed a model to detect any fraudulent transactions with a credit card.
- You are testing your model with a highly unbalanced dataset.
- What is the metric to be considered in this case?
- It is okay to classify a legit transaction as fraudulent — it can always be re-verified by passing through additional checks.
- But it is definitely not okay to classify a fraudulent transaction as legit (false negative).
- So here false negatives should be reduced as much as possible.
- Hence in this case, Recall is more important.
Que:
- For the given data, construct the confusion matrix.
- Calculate the recall from the confusion matrix.
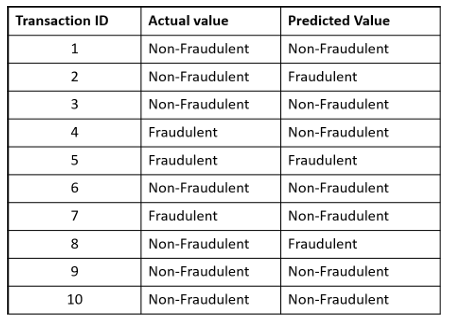
Solution:
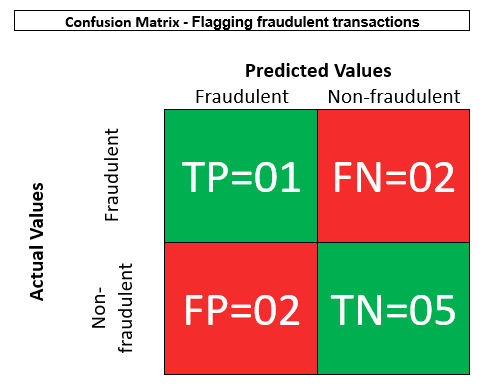
Recall = Correct Positive PredictionsTotal Actual Positive Values = TPTP + FN = 11 + 2 = 13 = 0.333
3.5 Ethical concerns around model evaluation
While evaluating an AI model, the following ethical concerns need to be kept in mind.

Bias
Ensure that the evaluation metrics chosen don’t result in any kind of bias.
Transparency
An honest explanation of how the chosen evaluation metrics work and produce results without keeping any information hidden.
Accountability
Take responsibility for your choice of metrics and methodology of evaluation in case any user faces a disadvantage because of your chosen methodology.
By Anjeev Kr Singh – Computer Science Educator
Published on : February 24, 2026 | Updated on : February 24, 2026
About the Author